Breakthrough Method for Estimating CO2 Emissions With 14C
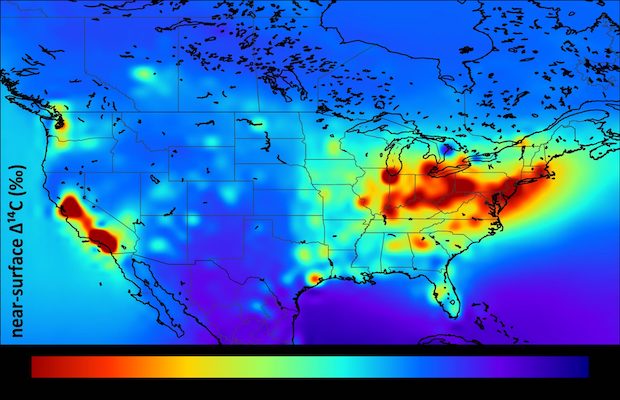
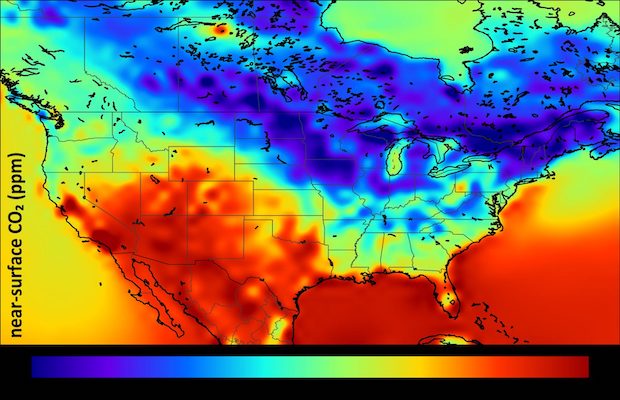 The study team used measurements of atmospheric CO2 and its radiocarbon content (Δ14C) to ‘unmask’ the contribution of CO2 from fossil fuel combustion and cement production to the observed total. This map shows concentrations of CO2 across the US in the summer of 2010. Credit: Sourish Basu, CIRE
Researchers from the National Oceanic and Atmospheric Administration (NOAA) – under the US Department of Commerce and the University of Colorado have devised a breakthrough method for estimating national emissions of carbon dioxide (CO2) from fossil fuels using ambient air samples and a well-known isotope of carbon (14C) that scientists have relied on for decades to date archaeological sites.
In a paper published in the journal the Proceedings of the National Academy of Sciences, they report the first-ever national scale estimate of fossil-fuel derived carbon dioxide (CO2) emissions obtained by observing CO2 and its naturally occurring radioisotope, Carbon-14, from air samples collected by NOAA’s Global Greenhouse Gas Reference Network.
Carbon-14, or 14C, a very rare isotope of carbon created largely by cosmic rays, has a half-life of 5,700 years. The carbon in fossil fuels has been buried for millions of years and therefore is completely devoid of 14C.
Careful laboratory analysis can identify the degree of 14C-depletion of the CO2 in discrete air samples, which reflects the contribution from fossil fuel combustion and cement manufacturing (which also has no 14C), otherwise known as the “fossil CO2” contribution. Knowing the location, date and time when the air samples were taken, the research team used a model of atmospheric transport to disentangle the CO2 variations due to fossil fuel combustion from other natural sources and sinks, and traced the man-made variations to the fossil CO2 sources at the surface.
While the link between fossil CO2 emissions and atmospheric 14C has been known for many decades, the construction of a national-scale emission estimate based on atmospheric 14C required the simultaneous development of precise measurement techniques and an emissions estimation framework, largely spearheaded over the past 15 years by NOAA scientist John Miller and University of Colorado scientist Scott Lehman.
“Carbon-14 allows us to pull back the veil and isolate CO2 emitted from fossil fuel combustion,” said Lehman, one of the paper’s authors. “It provides us with a tracer we can track to sources on the ground. “We can then add these up and compare to other emissions estimates at various time and space scales”
The team constructed annual and monthly top-down fossil CO2 emission estimates for the U.S. for 2010, the first year with sufficient atmospheric samples to provide robust results. As one point of comparison, they compared their numbers to bottom-up estimates from a recent U.S. Environmental Protection Agency’s (EPA) report of 2010 emissions. The team’s estimate of the US annual total 2010 emissions was 5 percent higher than EPA’s central estimate. The new estimate is also significantly higher than those from other inventories commonly used in global and regional CO2 research. On the other hand, the atmospheric results appear to agree with a recent update of the Vulcan U.S. emissions data product developed by researchers at Northern Arizona University.
For reference – “Bottom-up” estimates, such as those used in the EPA Inventory of U.S. Greenhouse Gas Emissions and Sinks, are developed by counting CO2 emissions from various processes and fuel types, and then scaling up emissions based on records of fossil fuel use. In contrast, “top-down” estimates are based on measured changes in the concentrations of emitted gases in the atmosphere and wind patterns connecting the surface source regions with the measurement locations.
As these were the first estimates constructed using the new observing system, scientists cautioned that they should be considered provisional. Now they are busy applying the method to measurements from subsequent years, in order to determine if the differences they see are robust over time.
One of the benefits of this approach, according to the scientists, is that with an expanded 14C measurement network, there is the potential to calculate emissions from different regions — information that would augment EPA’s national totals. States such as California and collections of states such as the members of the eastern Regional Greenhouse Gases Initiative have created their own greenhouse gas mitigation targets, and the ability to independently evaluate regional emissions using top-down methods would help evaluate regional emissions reduction efforts.