High numbers, but low per capita. 5 ways India does a lot for the environment
The IPCC report on climate change had the grimmest possible warning for the world at large, with countries like India even more likely to literally feel the heat. So, as the world heads to Poland to discuss the next steps to prevent climate change, it is instructive to see just where India stands vis a vis the world on these 5 crucial indicators.
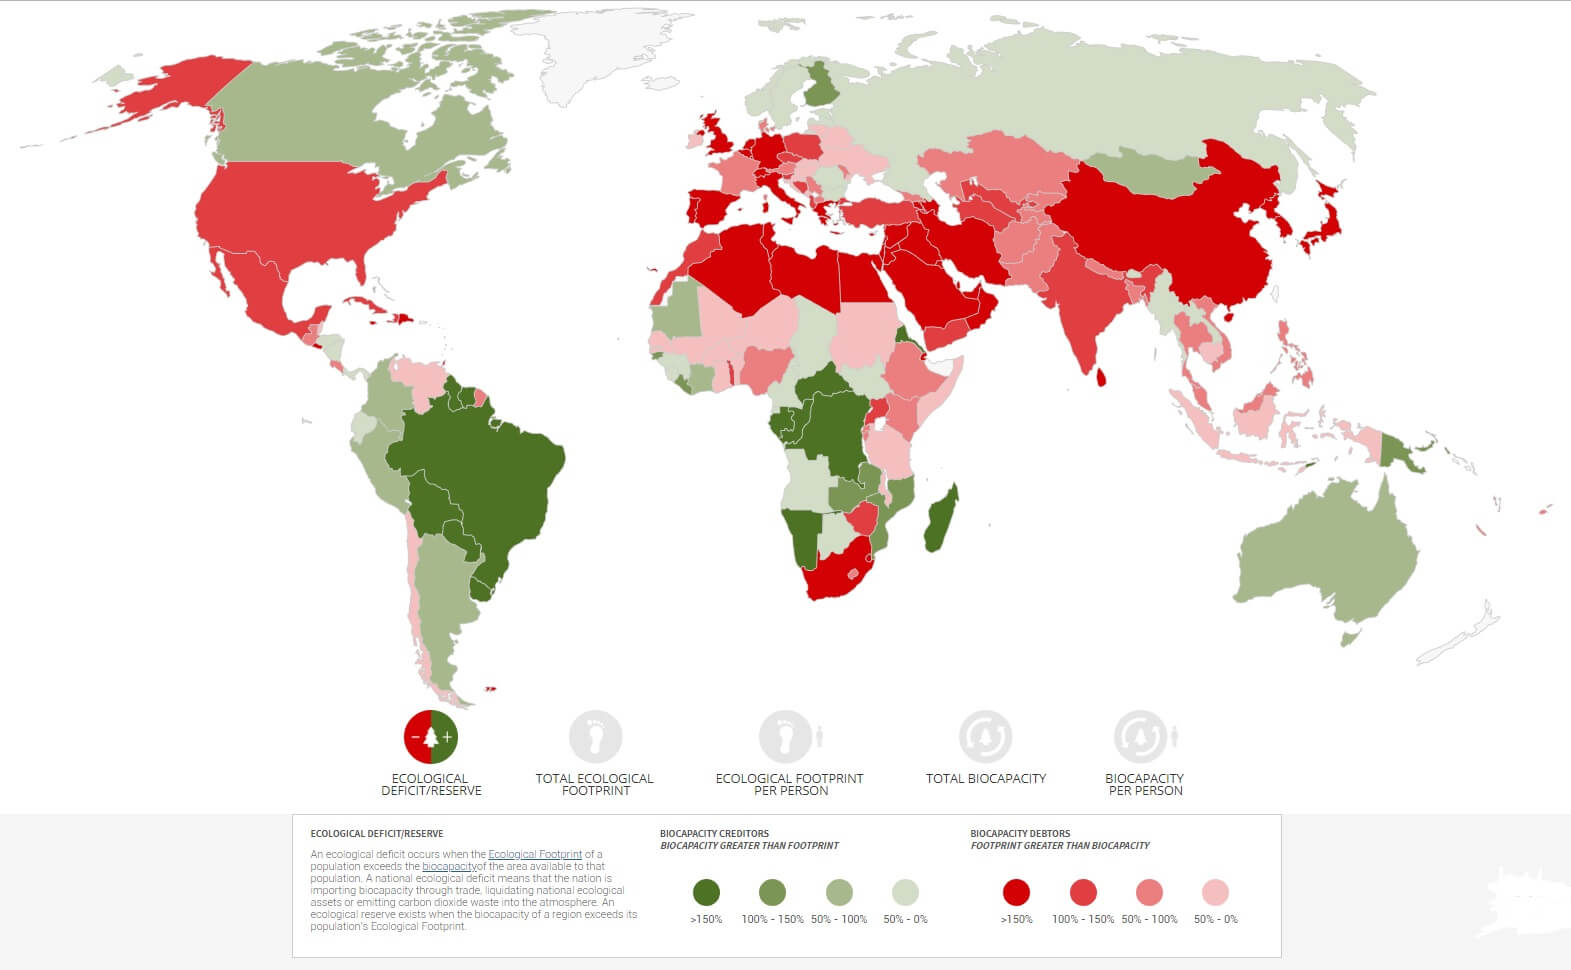
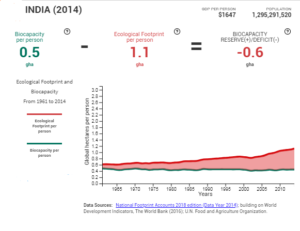
Ecological Footprint: In the simplest of terms, ecological footprint is the only metric that measures how much nature we have and how much nature we use. Measuring how fast we consume resources and generate waste compared to how fast nature can absorb our waste and generate new resources. If a population’s Ecological Footprint exceeds the region’s biocapacity, that region runs an ecological deficit. Its demand for the goods and services that its land and seas can provide—fruits and vegetables, meat, fish, wood, cotton for clothing, and carbon dioxide absorption—exceeds what the region’s ecosystems can renew.
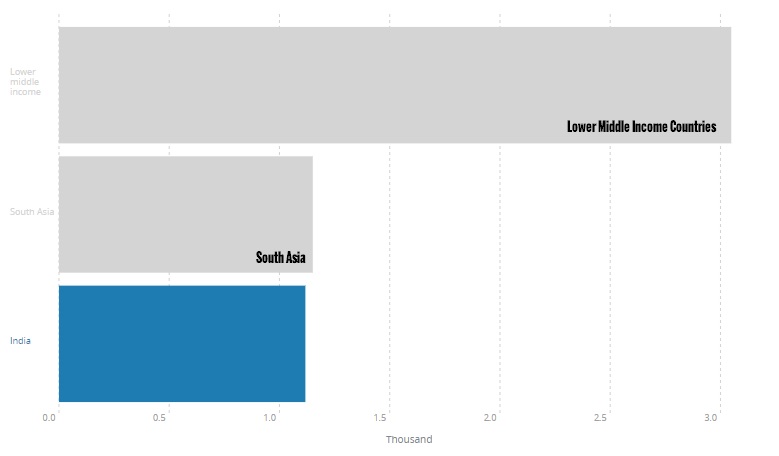
Per Capita Water Availability: The global demand for water has been increasing at a rate of about 1% per year as a function of population growth, economic development and changing consumption patterns, among other factors, and it is predicted to grow significantly over the next two decades according to the UN’s World Water Development Report 2018. At the same time, the global water cycle is intensifying due to climate change, with wetter regions generally becoming wetter and drier regions becoming even drier. At present, an estimated 3.6 billion people (nearly half the global population) live in areas that are potentially water-scarce at least one month per year, and this population could increase to some 4.8–5.7 billion by 2050.
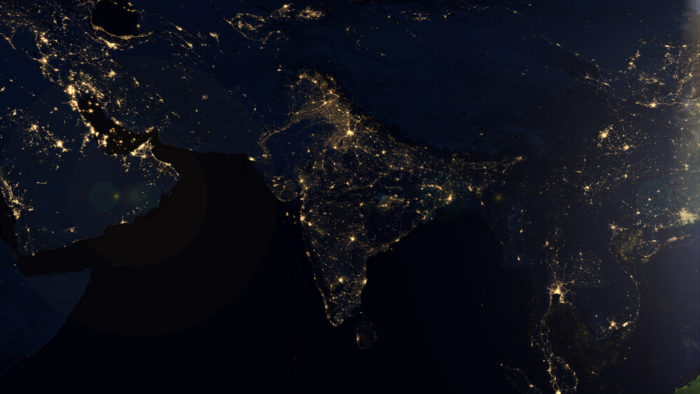
Per Capita Energy Consumption:
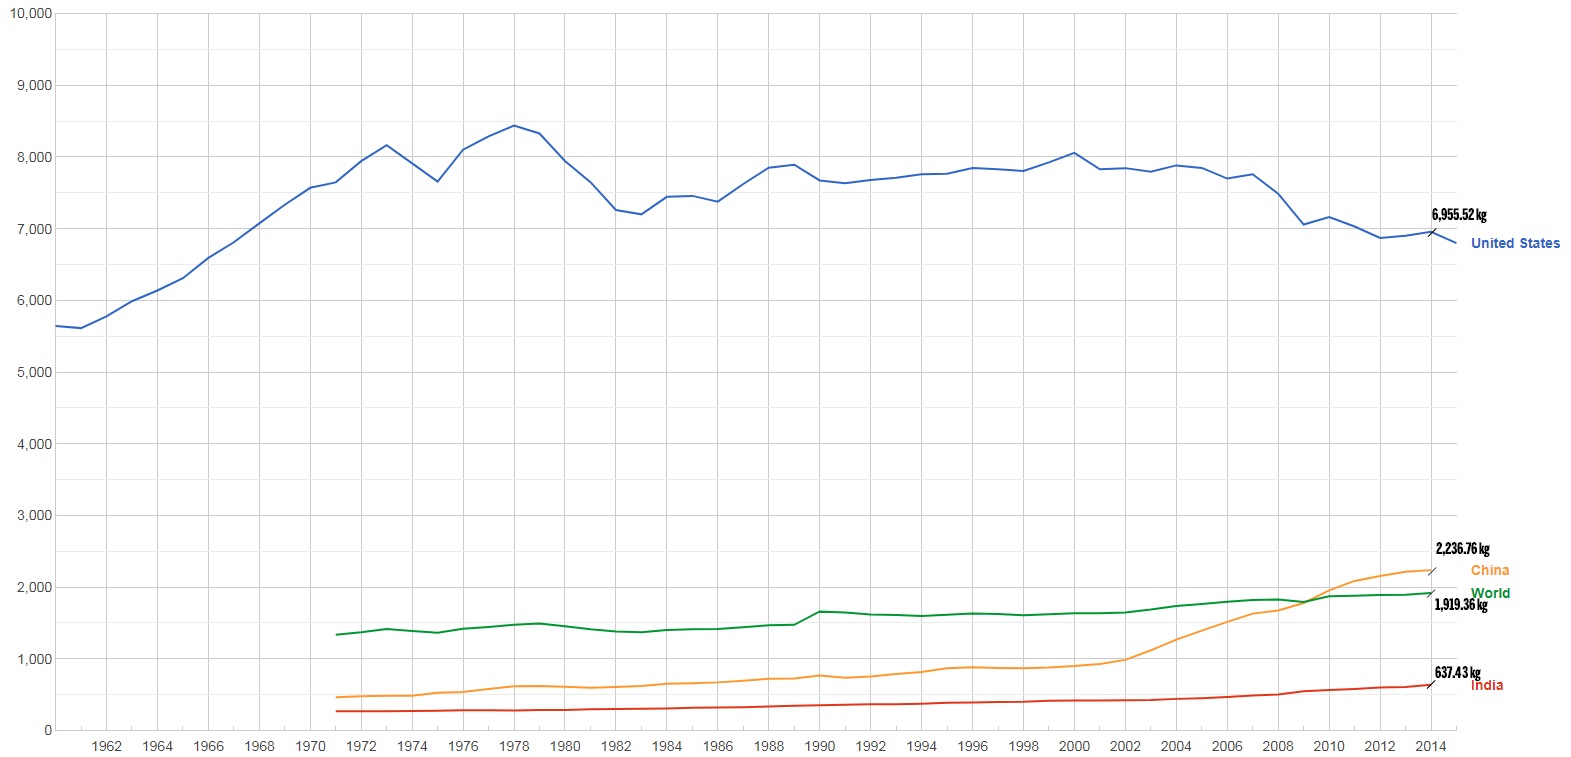
Per Capita Meat Consumption: Meat can be part of a balanced diet contributing valuable nutrients that are beneficial to health. Meat and meat products contain important levels of protein, vitamins, minerals and micronutrients which are essential for growth and development. However, the destructive impact of animal agriculture on the environment far exceeds that of any other technology on Earth. The greenhouse gas footprint of animal agriculture rivals that of every car, truck, bus, ship, airplane, and rocket ship combined. There is no pathway to achieve the Paris climate objectives without a massive decrease in the scale of animal agriculture.
India’s per-capita consumption of meat stands at 4.4 kg (2014) per person, which puts it at the second position on the list of countries with the least meat consumption per-person. This distinction can be attributed to a 2000-year-old tradition of vegetarianism, besides limited access to meat for the poor. However, the demand for meat is expected to grow faster in India with sustained economic growth, rising per capita income, strengthening urbanization trends and increasing awareness of the nutritive value of meat and meat products. By 2020, the demand for milk is estimated to reach 143 million tonnes and that of meat and eggs eight million tonnes.
Per Capita Plastic Consumption: As on date, every state in India has a plastic ban of some shape or size in effect, save for two. While the efficacy of these moves can still be questioned, there is no doubt that the bans send a strong message of intent, and at least ensure that the law will already be ready when the authorities do get serious about implementing it. More importantly, awareness of the negative effects of plastics use are spreading fast, and increasingly visible too. The per capita consumption in India is still low compared to more developed countries. According to FICCI, Indians today consume 11 kg of plastic per year in comparison to 109 kg by an average American.
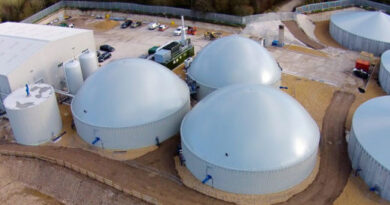
India has made serious efforts to do its part by adding renewable energy at one of the fastest speeds anywhere. Renewable Energy capacity additions in India has surprised everyone with its growth. Power generation from solar and wind power has grown faster than expected in all but the most saturated markets, giving everyone reason for high hopes that this sector can do much more. Add to this the high ‘carbon tax’ in the form of the unpopular but essential fuel taxes in a bid to drive more and more traffic towards cleaner fuels and electric mobility – which the government is strongly pushing for central as well as state levels. India’s pledge to stop using single use plastics by 2022, well before many countries including developed nations, is a bold indication of India’s commitment to fighting climate change.