IEA Report: Energy-Linked CO2 Emissions Hit a Record High in 2018

The International Energy Agency in its ‘Global Energy & CO2 Status Report‘ gave an exhaustive analysis of the global energy trends and CO2 emissions. The demand of energy saw a spike of 2.3 percent in 2018, nearly twice the average rate of growth since 2010, driven by a robust global economy as well as higher heating and cooling needs in some parts of the world. Also, China, United States and India collectively accounted for nearly 70 % of the rise in energy demand around the world.
“We have seen an extraordinary increase in global energy demand in 2018, growing at its fastest pace this decade,” said IEA Executive Director Fatih Birol. “Last year can also be considered another golden year for gas, which accounted for almost half the growth in global energy demand.”
CO2 Emissions
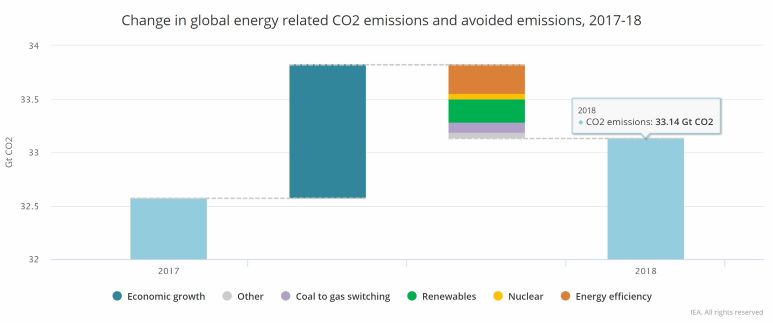
Natural Gas was the fuel of choice last year, accounting for nearly 45% of the increase in total energy demand. As a result of higher energy consumption, CO2 emissions hit a new record. Global energy-related CO2 emissions increased to 33.1 Gt CO2, up 1.7%. Coal-fired power generation continues to be the single largest emitter, accounting for 30% of all energy-related carbon dioxide emissions.
The United States had the largest increase in oil and gas(10%) demand worldwide.
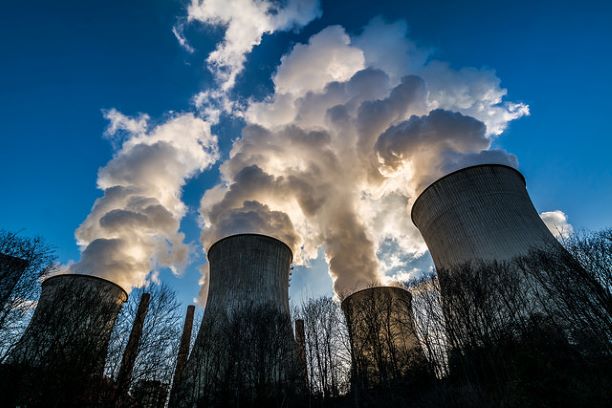
For the first time, the IEA assessed the impact of fossil fuel use on global temperature increases. It found that CO2 emitted from coal combustion was responsible for over 0.3°C of the 1°C increase in global average annual surface temperatures above pre-industrial levels. This makes coal the single largest source of global temperature increase. Coal-fired electricity generation accounted for 30% of global CO2 emissions, and majority of these emissions came from Asia.
In China, CO2 emissions grew by 2.5%, or 230 Mt, to 9.5 Gt. A jump of over 5% in electricity generation from coal-fired power stations drove up emissions by 250 Mt, which more than offset the impact of a decline in coal use outside of the power sector.
India saw emissions rise by 4.8%, or 105 Mt, with the growth split evenly between power and other sectors such as transport and industry. Despite this growth, per capita emissions in India remain low at only 40% of the global average.
Emissions declined in Japan for a fifth year, with a decline across all fossil fuels largely due to both continued improvements in energy efficiency and the increase in generation from nuclear power stations.
Elsewhere, the United States saw a reversal of emission reductions, with an increase of 3.1% in CO2 emissions in 2018. Across Europe emissions fell by 1.3%, or 50 Mt, like a drop of 4.5% in Germany, as both oil and coal combustion fell sharply; Electricity generation from renewables also saw a record year in the United Kingdom, accounting for 35% of generation, as the share of coal fell to 5%, a record low.
Coal
Global coal demand increased by 0.7% in 2018, or 40 Mtce, growing for a second year as higher demand in Asia outpaced declines everywhere else. Coal’s shift to Asia continued in 2018. The growth in demand for coal took place in only some countries in Asia – China, India and a few countries in South and Southeast Asia – primarily because of the increased demand for electricity in these countries, for which coal generally outcompetes natural gas.
Related Post


In China, coal consumption rose by 1% last year, coal power generation increased by 5.3% in 2018 to meet China’s strong power demand growth.
India’s 7% economic growth, the highest among large economies, created strong coal demand, especially for electricity generation and steel production as India surpassed Japan to become the world’s second-largest steel producer behind China. New solar and wind capacity met less than a third of the growth in electricity demand, while coal supplied the bulk of additional electricity generation. As a result, coal demand in India grew by around 5%.
In Southeast Asia, coal use in Indonesia, Viet Nam, the Philippines and Malaysia increased significantly however in Japan and Korea, coal demand posted a small decline in 2018.
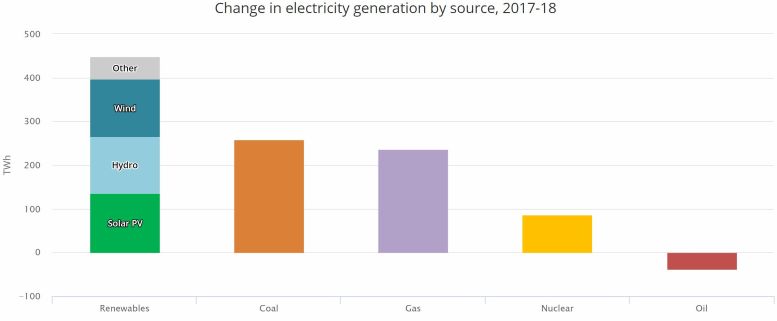
Renewables
Renewables increased by 4% in 2018, accounting for almost one-quarter of global energy demand growth. Renewables-based electricity generation increased by 7%, almost 450 TWh, equivalent to Brazil’s entire electricity demand. Taken together, renewables were responsible for almost 45% of the world’s increase in electricity generation. They now account for almost 25% of global power output, second after coal.
“But despite major growth in renewables, global emissions are still rising, demonstrating once again that more urgent action is needed on all fronts — developing all clean energy solutions, curbing emissions, and spurring investments and innovation, including in carbon capture, utilization and storage,” Birol adds.
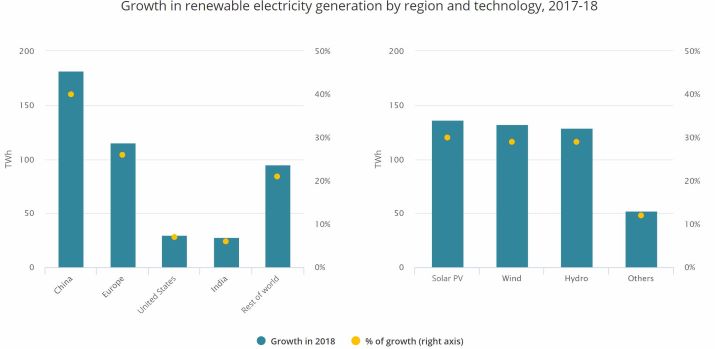
China accounted for over 40% of the growth in renewable-based electricity generation, followed by Europe, which accounted for 25%. The United States and India combined contributed another 13%. Renewables have also grown rapidly outside of these major markets.
China’s annual solar PV capacity additions were at 44 GW in 2018, lower than the increase of 53 GW in 2017. In the United States and India, solar PV annual capacity additions remained similar to 2017 levels while Europe saw growth.
Electricity generation from wind grew by an estimated 12% in 2018, as China’s wind capacity expansion increased from 15 GW in 2017 to 20 GW in 2018.
Hydropower output increased by an estimated 3% on the back of Latin America and China. Overall, hydropower remains the largest renewable energy technology, accounting for around 60% of all electricity supply from renewables.
In transport, global biofuels production increased 6% in 2018. Brazil’s ethanol production rose 12% while China saw a record growth of 24% and India’s production rebounded, driven by a large supply of feedstocks and relatively higher oil prices.
Electricity
Global electricity demand rose by 4% in 2018 or 900 TWh. China and the United States, the world’s two largest power markets, accounted for 70% of global demand growth. In China, electricity demand increased by 8.5%, a notable uptick compared with recent years. This was led by the industrial sector, including iron, steel and other metals, cement and construction, as well as higher demand for cooling.
India’s power demand increased by around 65 TWh, or 5.4%, a slower rate than the previous year. The increase was driven by higher demand in buildings from air conditioning and Village electrification that added around 30 million people to its grid.
Energy efficiency
Energy efficiency across the global economy continued to improve in 2018, with global primary energy intensity falling by 1.3%.
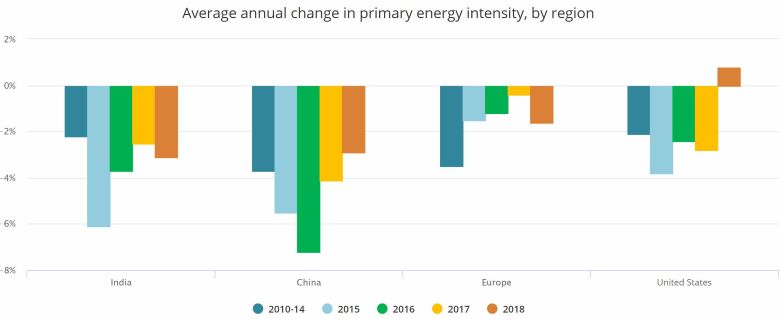
The slowdown in the rate of energy efficiency improvement means that efficiency offset 40% less CO2 emissions in 2018. Europe and India both saw an increase in the rate of improvement for energy efficiency in 2018 relative to 2017 also slowdowns in other major regions dictated the direction of the global average.
In China, robust policies led the primary energy intensity improve by 2.9% in 2018. In India, primary energy intensity improved by just over 3% although energy demand was still 4% higher.