Climate Change: World Moving in the Wrong Direction; 12 Charts Show
Background:
Let us break the happy little bubble we all have created around us. Despite the news that the ‘transition’ towards cleaner energy and lower carbon emission is becoming a reality; the truth is far from it. Let’s get some facts right in the beginning…
First, Global emissions are not falling or if they are, they aren’t declining at the rate that may do any good. In fact thanks to China and the US (the biggest fossil guzzlers and their climate denying propensities) the emissions spurred 1.7% last year.
Second, traveling in the wrong direction continues as subsidies to fossil fuels were up 11 % between 2016 and 2017, reaching $300 billion a year in the entire world. And thirdly, as if that wasn’t enough, efforts to clean up our energy production is also flagging. Total investment in renewable energy (not including hydropower) was $288.9 billion in 2018 — less than fossil fuel subsidies and an 11 % decrease from 2017.
So, lets look at the charts that have bitter-sweet realities.
- Renewables in Power Sector: Some good news to begin with, globally, more renewable energy capacity has been installed than new fossil fuel and nuclear capacity combined, for almost four years in running.
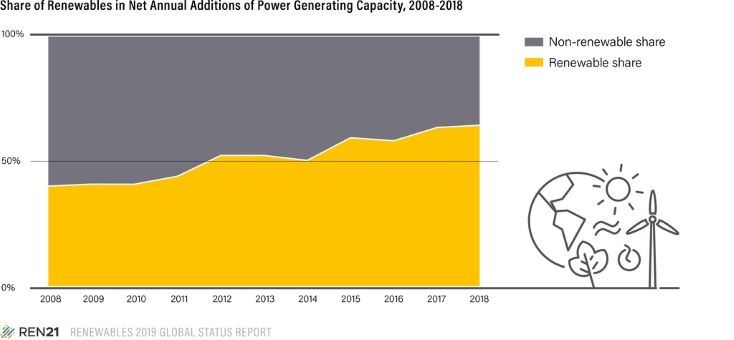 Some 181 GW of new renewables capacity was installed in 2018 which now makes up more than one-third of global installed power capacity. These are mainstream power sources, here to stay.
 - Solar PV is the King: While additions of wind and bioenergy capacity have been fairly stable; hydropower is down a bit. The primary reason renewable capacity additions are growing is the rise in solar photovoltaic (PV) panels.
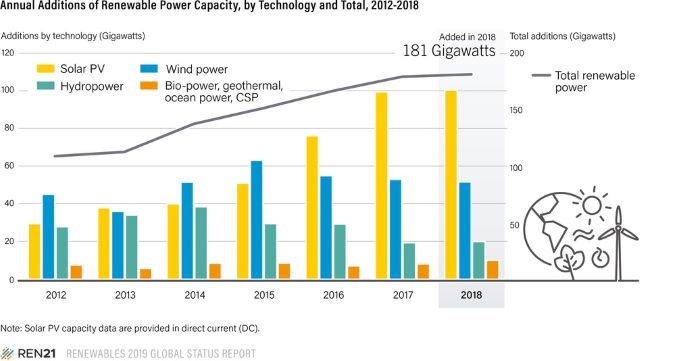 Of the new renewable energy capacity installed in 2018, 55 percent (about 100 GW) was solar PV; wind power had 28 percent, and hydropower 11 percent. The future of the world basically depends on solar continuing to boom.
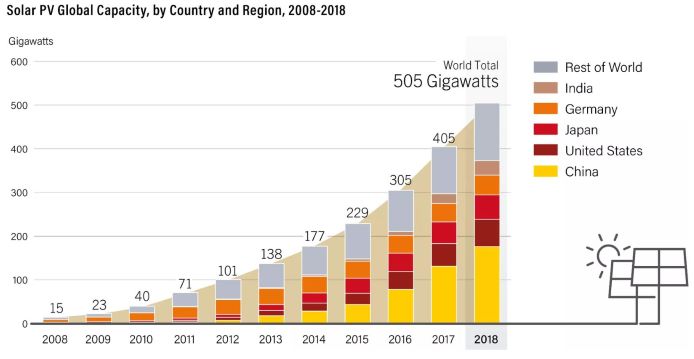
- China Leads with Solar: Solar holds the lead due to China where more than 150 GW of solar has been installed. There has been a rapid solar PV growth in the US, Japan (thanks to Fukushima and the subsequent shutdown of nuclear), and, more recently also in India.
- China Beats in all categories: The Asian giant is the biggest fish no matter what the category.
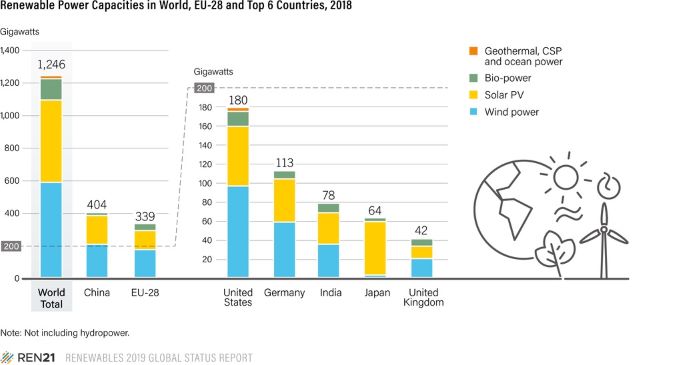 China was responsible for 32 percent of all global renewables investment in 2018. It was the lead investor in, and leads the world in installed capacity of, hydropower, solar PV, and wind. (A couple of things to note on the graph below: Japan’s unusually high proportion of solar and the comparatively large role of bio-power in the EU and US.)
- RE makes a dent: The push towards Renewable energy is making its mark or rather dent in the global electricity mix. According to the report, renewables represent more than a third of the world’s installed capacity and more than 26 percent of global electricity produced.
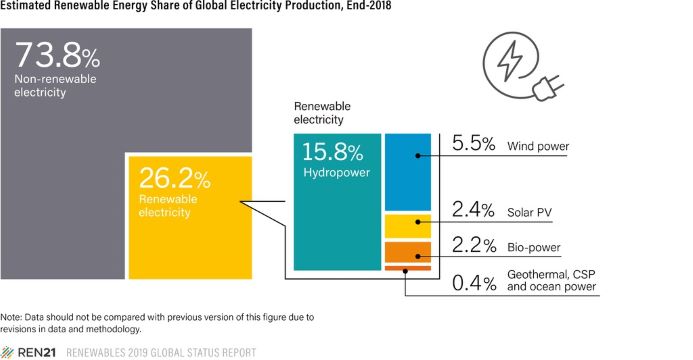 That being said, hydropower, at almost 16 percent, makes up more than half the renewables total. What people tend to think of as renewables, wind and solar, make up only a combined 8 percent. Even in electricity, renewables have a long way to go.
- Solar PV creates more jobs: As the previous graph shows Solar has been leading the way for renewables’, this has made the sector top employer amongst the other sources.
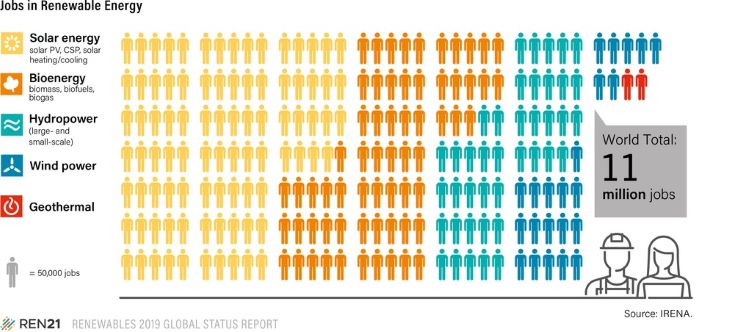 It accounts for the bulk of the world’s renewable energy jobs, despite being a minority of renewable energy capacity. Wind, which leads solar in capacity, creates far fewer jobs. Solar PV is very labor-intensive both long and short term job wise.
- Other than electricity, RE are scarce: Where renewables are 26 percent of global electricity, they represent less than 10 percent (renewable electricity less than 2 percent) of heating and cooling and just 3.3 percent (renewable electricity only 0.3 percent) of transportation energy.
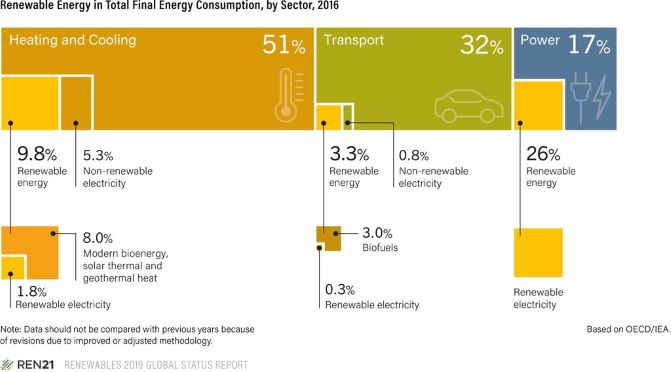 Heating and cooling, at 51 percent of global energy use, mostly run on natural gas and oil. Transportation, at 32 percent of global energy use, mostly runs on gasoline and diesel. There are 169 countries, at the national or state/provincial level, that have passed renewable energy targets. Meanwhile, the report says, “only 47 countries had targets for renewable heating and cooling, while the number of countries with regulatory policies in the sector fell from 21 to 20.” Fewer than a third of all countries worldwide have mandatory building codes, “while 60% of the total energy used in buildings in 2018 occurred in jurisdictions that lacked energy efficiency policies.” Only about a quarter of industrial energy use is covered by industrial energy-efficiency policies. It’s not much better in transportation, where “fuel economy policies for light-duty vehicles existed in only 40 countries by year’s end and have been largely offset by trends towards larger vehicles.” Carbon pricing isn’t helping much either. “Carbon pricing remains acutely under-utilised,” the report says. “By the end of 2018, only 44 national governments, 21 states/provinces and 7 cities had implemented carbon pricing policies, covering just 13% of global CO2 emissions.”
- Transportation is following Electricity’s path: A shift is underway in transportation despite being fossil dependent sector in the world.
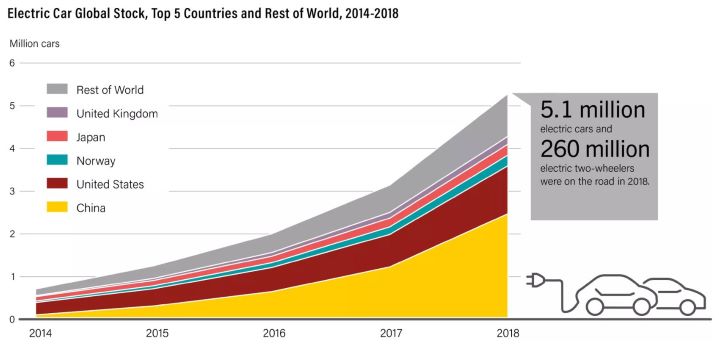 In 2018, “the global number of electric passenger cars increased 63% compared with 2017,” the report says, “and more cities are moving to electric bus fleets.” Here, too, China is outpacing the rest of the world, though shout out to the tiny country of Norway, whose aggressive EV policies have it showing up in global statistics.
- Cities outpace Countries on Clean energy: The report’s chapter 8 brought what cities can do instead of countries which should learn from them. On average, cities — which represent 65 percent of global energy demand and house more than half the world’s people — use a higher percentage of renewable electricity than countries.
 Already, there are at least 100 cities around the world using between 90 and 100 percent renewable electricity. At least 230 have set a 100 percent renewable energy goal in at least one sector.
- Fossil Subsidies Needs Clean break: Despite global decry, Direct fossil fuel subsidies grow — rising 11 percent to $300 billion in 2017. “While at least 40 countries have undertaken some level of fossil fuel subsidy reform since 2015,” the report says, “fossil fuel subsidies remained in place in at least 112 countries in 2017, with at least 73 countries providing subsidies of more than USD 100 million each.”
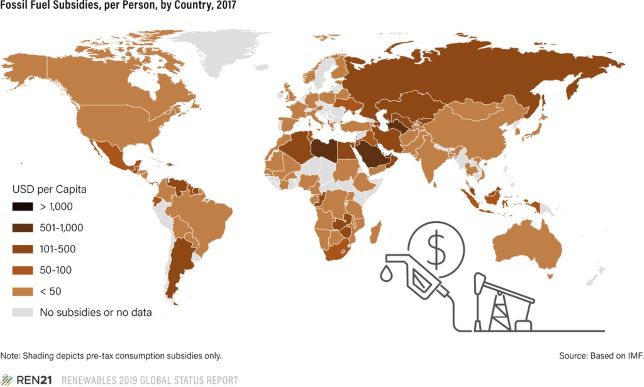 Globally, that is “about double the estimated support for renewable power generation,” the report says. On the other hand, IMF estimates total fossil fuel subsidies — both direct, in terms of tax and cash transfers, and indirect, in terms of unpriced environmental damages — reached $5.2 trillion in 2017. And they are concentrated in countries where they will be difficult to root out.
- Energy Intensity’s slow decline: Energy Intensity is the amount of energy used to produce a unit of GDP. In theory, if you can reduce energy intensity fast enough, you can offset the natural rise in energy consumption (from population and economic growth) and even cause total energy demand to decline.
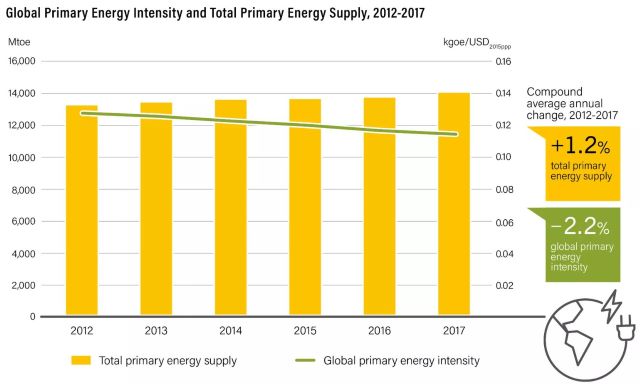 In reality, global energy intensity has declined just 2.2 percent in the past five years. That has not been enough to offset the rise in global energy demand, which crept up 1.2 percent. Energy intensity is declining at around 0.4 percent a year. To hit midcentury global decarbonization targets, global energy intensity would need to decline by between 4 and 10 percent a year. That means the world needs to accelerate efficiency and electrification rates by about 10 times.
- RE needs to sprint: As of 2017, fossil fuels were still providing about 80 percent of humanity’s energy, which is roughly what they’ve been providing for decades.
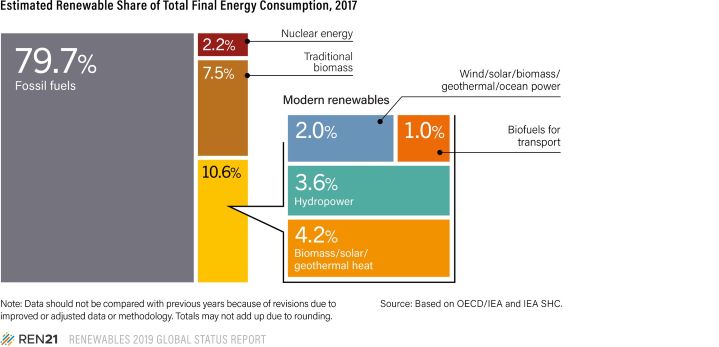 Excluding traditional biomass, with all its problems around clearcutting, monocropping, and competing with food for land, you’re left with about 13 percent plausibly climate-friendly energy (different people may want to exclude other sources as well, but the larger point stands).
That 13 percent needs to get to 100 percent, or close to it, by 2050 — which is, you will note, just 30 years away. With many countries still dilly-dallying with the concept of Climate change or are simply lazing their way with the rapid need to change, 30 years do not look too many in general sense.
So while the news may show that the world is moving in the right direction, it, in fact, hides the real truth about the pace at which it should pick up. The world’s governments urgently need to look past the sparkly good news in the electricity sector and bear down on heating and transportation, where most of the energy is being consumed. Energy systems need to be rapidly electrified and integrated, which will require policy support at every level. In short, even if overall energy demand all over the world falls, all renewables will need to grow, rapidly, across all economies within the next few years.